Basic Plotting
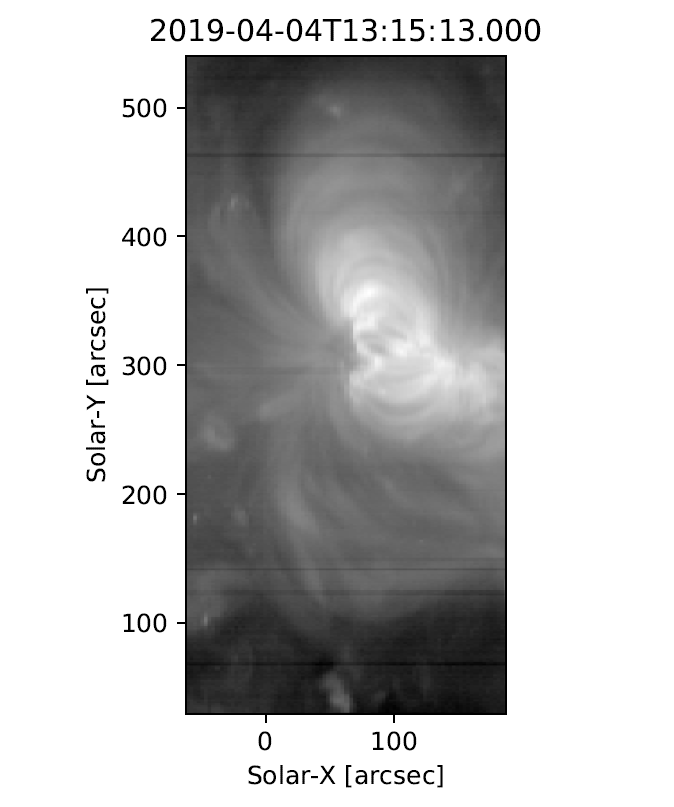
Making a log-scaled plot of intensities summed over the wavelength axis.
import numpy as np
import matplotlib.pyplot as plt
import eispac

data_filename = 'eis_20190404_131513.data.h5'
data_cube = eispac.read_cube(data_filename, 195.119)
raster_sum = np.sum(data_cube.data, axis=2) # or data_cube.sum_spectra().data
scaled_img = np.log10(raster_sum)

plt.figure()
plt.imshow(scaled_img, origin='lower', extent=data_cube.meta['extent_arcsec'], cmap='gray')
plt.title(data_cube.meta['date_obs'][-1])
plt.xlabel('Solar-X [arcsec]')
plt.ylabel('Solar-Y [arcsec]')
plt.show()
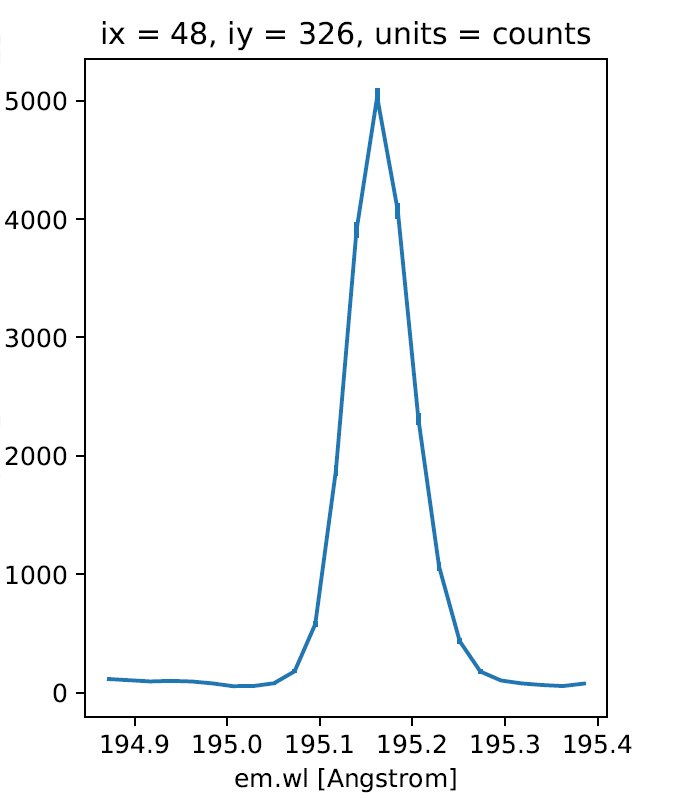
Plotting a single line profile (in units of counts)
>>> ix = 48
>>> iy = 326
>>> spec = data_cube[iy,ix,:].remove_radcal()
>>> spec_plot = spec.plot()
>>> spec_plot.set_title(f'ix = {ix}, iy = {iy}, units = counts')