EIS Data Overview
The EUV Imaging Spectrometer — EIS — was designed to study the solar atmosphere and answer fundamental questions on the heating of the solar corona, the origin of the solar wind, and the release of energy in solar flares [1]. EIS observes two wavelength bands in the extreme ultraviolet, 171–-212 Å and 245–-291 Å, with a spectral resolution of about 22 mÅ and a plate scale of 1″ per pixel. However, it is not practical to observe the entirety of these bands at all times; therefore EIS observations are typically collected in discrete spectral “windows” containing a smaller wavelength range centered on select lines of interest. These windows can vary depending on the particular study and a single EIS observation can contain up to 25 windows.
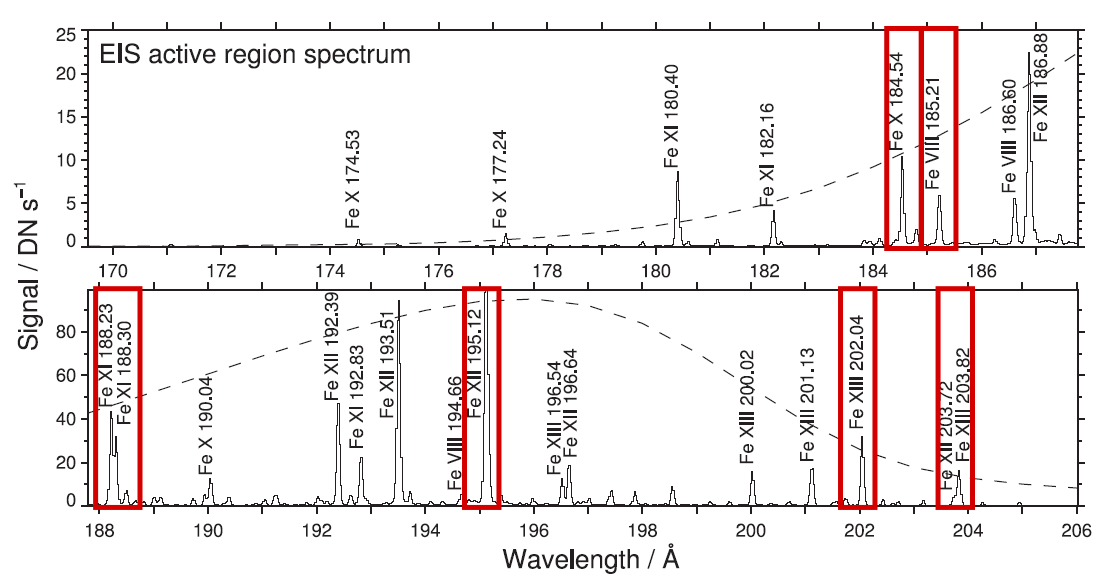
Fig. 1 Example EIS spectrum of an active region on 2006 November 4 observed in the 171–-212 Å EUV band. Red boxes demonstrate the bounds of some common spectral windows used by observation planners. The dashed line shows the effective area of EIS, which determines the sensitivity of the instrument to specific wavelengths. Adapted from Figure 2 of Young et al., 2007 [2]
EIS has two basic modes of operation, “scan” and “sit-and-stare”, which comprise ~89% and 11% of all observations respectively. In scan mode, solar images are made by stepping the slit over a region of the Sun and taking an exposure at each position. Sit-and-stare observations, on the other hand, involve taking one or more long exposures of a single location. The EIS slit is always oriented along the Solar-Y (north-south) axis. As a consequence, scan positions are always stepped along the Solar-X (east-west) axis, starting at the edge of the observed region nearest the solar west limb and proceeding towards the east limb.
A detailed description of EIS is given in the instrument paper [3]. At the beginning of the Hinode mission, the strategy was to release unprocessed level-0 FITS files and software routines written in IDL for processing these files into a format that could be used for data analysis. Additionally, all of the routines for computing ancillary information, such as the offsets of the detectors or the magnitude of the instrumental broadening, were all written in IDL. Unfortunately, IDL is an expensive, proprietary language, little used outside of solar physics. Python, in contrast, is a free, open source language that has grown dramatically in popularity since the launch of Hinode, making it an obvious choice for future software development.
EIS Level-1 HDF5 Files
To accelerate the transition to Python we have created a new level-1 product that contains both the processed level-1 data and all ancillary information needed for data analysis. The alternative approach, to port all of the existing IDL software to Python, would be time consuming and create confusion about which routines are being actively supported during the transition. Distributing level-1 files removes this problem, but does make the user dependent on the team for reformatting all of the files as bugs are discovered. Since the mission has been going on for some time now, the number of bugs is likely to be small.
There are several other design decisions that merit some explanation
The data and header information are stored in separate files. Since the data is large and unlikely to change, the time-consuming download of these files should only need to be done once. The header file is very small and can be updated easily.
HDF5 is used to store the data. This is a very widely used, high-performance file format that is well supported by both IDL and Python. The most attractive feature for this application is that data is stored in a self-documenting, directory-like tree structure instead of binary table extensions.
The data is processed from raw “data numbers” to “photon events” or “counts”. The default behavior of
eis_prepis to convert to calibrated units. With the HDF5 files, conversion to absolute units is done using a calibration curve in the header file, and several different calibration curves can be considered.
The processed level-1 HDF5 files can be downloaded either directly from the NRL Hinode/EIS website at https://eis.nrl.navy.mil/ or using the tools included in EISPAC. The chapter on Level-1 HDF5 File Processing describes how the files were processed.
Note
The HDF5 data archive currently only contains the science observations from the 1″ & 2″ slit positions. Engineering, calibration, and 40″ & 266″ slot data are therefore not available as HDF5 files.
Footnotes and Citations